Multiple Choice
 The figure shows the competitive market for milk.
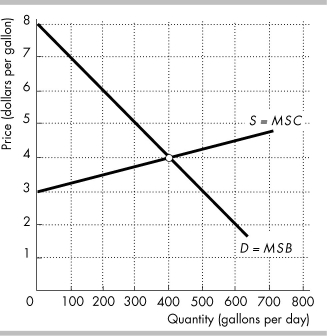
-In the figure above, when the quantity of milk produced is 600 gallons per day, what is the deadweight loss?
A) $250
B) $125
C) $500
D) $50
Correct Answer:

Verified
Correct Answer:
Verified
Q69: The producer surplus on a unit of
Q70: <img src="https://d2lvgg3v3hfg70.cloudfront.net/TB8586/.jpg" alt=" -The figure above
Q71: If the market for diamonds is a
Q72: <img src="https://d2lvgg3v3hfg70.cloudfront.net/TB8586/.jpg" alt=" -The figure above
Q73: If the government subsidizes the production of
Q75: <img src="https://d2lvgg3v3hfg70.cloudfront.net/TB8586/.jpg" alt=" -The figure above
Q76: <img src="https://d2lvgg3v3hfg70.cloudfront.net/TB8586/.jpg" alt=" -The above figure
Q77: <img src="https://d2lvgg3v3hfg70.cloudfront.net/TB8586/.jpg" alt=" -Homer, Bart, and
Q78: At the current quantity of table saws,
Q79: If you increase your consumption of soda