Multiple Choice
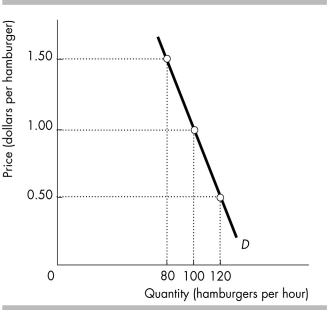
-The figure illustrates the demand for hamburgers. When the price is $1.00 a hamburger, the elasticity of demand is ________ and a 1 percent increase in the price will ________ the quantity of hamburgers demanded by ________ percent.
A) 1.00; decrease; 0.40
B) 0.40; decrease; 0.40
C) 2.50; increase; 2.50
D) 5.00; decrease; 5.00
Correct Answer:

Verified
Correct Answer:
Verified
Q137: Elasticity measures the<br>A) percentage change in a
Q138: The price elasticity of demand is 5.0
Q139: Joe's monthly income increases from $1,000 to
Q140: The demand for corn increases. As a
Q141: Suppose the quantity supplied of computers increases
Q143: If the demand for a good is
Q144: The income elasticity of demand is defined
Q145: The price elasticity of demand is always
Q146: Water is considered a necessity. So, is
Q147: Last year the price of corn was