Multiple Choice
 The figure shows the unregulated market for a pesticide, where S is the supply curve and D is the demand curve. The demand curve is the same as the MSB curve. When factories produce the pesticide, they also create waste, which they dump into a lake on the outskirts of the town. The marginal external cost of the dumped waste is equal to the marginal private cost of producing the pesticide.
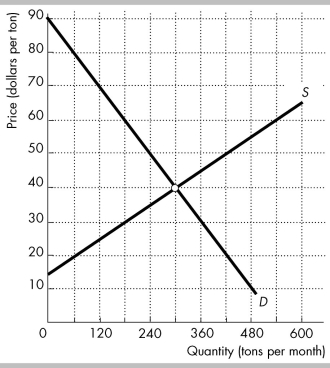
-In the figure above, if the output is 180 tons per month, what is the marginal social cost of producing the pesticide?
A) $60
B) $30
C) $40
D) $50
Correct Answer:

Verified
Correct Answer:
Verified
Q1: <img src="https://d2lvgg3v3hfg70.cloudfront.net/TB8586/.jpg" alt=" -The above figure
Q2: <img src="https://d2lvgg3v3hfg70.cloudfront.net/TB8586/.jpg" alt=" -The above figure
Q3: The granite boulders in Rocky Mountain National
Q5: When production of a good results in
Q6: "According to the Coase theorem, if Gabriel
Q7: <img src="https://d2lvgg3v3hfg70.cloudfront.net/TB8586/.jpg" alt=" -The table above
Q8: <img src="https://d2lvgg3v3hfg70.cloudfront.net/TB8586/.jpg" alt=" -In the above
Q9: The tragedy of the commons is the
Q10: In which of the following markets are
Q11: The difference between the marginal social cost