Multiple Choice
 The figure shows the unregulated market for a pesticide, where S is the supply curve and D is the demand curve. The demand curve is the same as the MSB curve. When factories produce the pesticide, they also create waste, which they dump into a lake on the outskirts of the town. The marginal external cost of the dumped waste is equal to the marginal private cost of producing the pesticide.
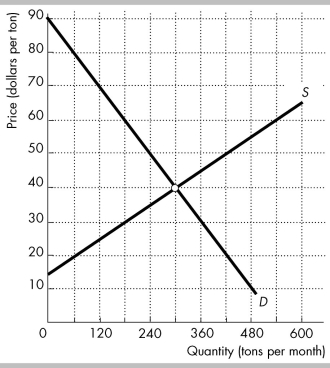
-In the figure above, what is the efficient quantity of pesticide to produce?
A) 300 tons per month
B) 240 tons per month
C) 180 tons per month
D) 360 tons per month
Correct Answer:

Verified
Correct Answer:
Verified
Q155: For a common resource, efficiency requires that
Q156: The three main methods that governments use
Q157: The benefit from an additional unit of
Q158: The granite boulders in Rocky Mountain National
Q159: The government can use taxes to<br>A) change
Q161: <img src="https://d2lvgg3v3hfg70.cloudfront.net/TB8586/.jpg" alt="
Q162: What is the Coase theorem? What conditions
Q163: <img src="https://d2lvgg3v3hfg70.cloudfront.net/TB8586/.jpg" alt=" -The above table
Q164: A key contribution of Ronald Coase is
Q165: <img src="https://d2lvgg3v3hfg70.cloudfront.net/TB8586/.jpg" alt="