Multiple Choice
 The figure shows the unregulated market for a pesticide, where S is the supply curve and D is the demand curve. The demand curve is the same as the MSB curve. When factories produce the pesticide, they also create waste, which they dump into a lake on the outskirts of the town. The marginal external cost of the dumped waste is equal to the marginal private cost of producing the pesticide.
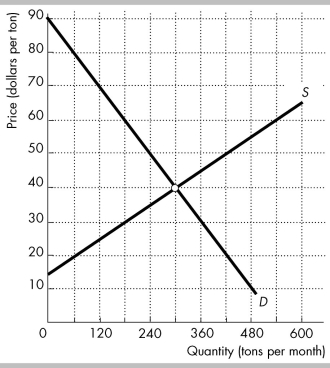
-In the figure above, if no one owns the lake, what is the deadweight loss in the market?
A) $2,400 per month
B) $1,800 per month
C) $3,600 per month
D) zero
Correct Answer:

Verified
Correct Answer:
Verified
Q96: <img src="https://d2lvgg3v3hfg70.cloudfront.net/TB8586/.jpg" alt=" -Using the above
Q97: <img src="https://d2lvgg3v3hfg70.cloudfront.net/TB8586/.jpg" alt=" -In the above
Q98: The government can aid in reducing pollution
Q99: When CSU sophomore Cody Clow and his
Q100: If the marginal social cost of a
Q102: <img src="https://d2lvgg3v3hfg70.cloudfront.net/TB8586/.jpg" alt=" -In the above
Q103: <img src="https://d2lvgg3v3hfg70.cloudfront.net/TB8586/.jpg" alt=" -The above figure
Q104: When the production of a good creates
Q105: <img src="https://d2lvgg3v3hfg70.cloudfront.net/TB8586/.jpg" alt=" -In the above
Q106: The Coase theorem applies when property rights