Multiple Choice
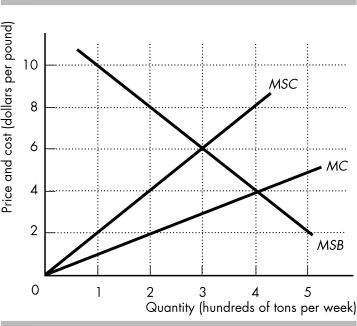
-The above figure shows the marginal private cost curve, marginal social cost curve, and marginal social benefit curve for cod, a common resource. A quota to prevent the overuse of the cod sets the catch equal to
A) 0 tons per week.
B) 300 tons per week.
C) 400 tons per week.
D) None of the above answers is correct.
Correct Answer:

Verified
Correct Answer:
Verified
Q143: Which of the following is a possible
Q144: <img src="https://d2lvgg3v3hfg70.cloudfront.net/TB8586/.jpg" alt=" -In the figure
Q145: If a good has zero external costs,
Q146: <img src="https://d2lvgg3v3hfg70.cloudfront.net/TB8586/.jpg" alt=" -In the figure
Q147: A polluted river has 20 homes on
Q149: <img src="https://d2lvgg3v3hfg70.cloudfront.net/TB8586/.jpg" alt=" -In the above
Q150: <img src="https://d2lvgg3v3hfg70.cloudfront.net/TB8586/.jpg" alt=" -The table above
Q151: <img src="https://d2lvgg3v3hfg70.cloudfront.net/TB8586/.jpg" alt=" -In the above
Q152: If a good has an external cost,
Q153: <img src="https://d2lvgg3v3hfg70.cloudfront.net/TB8586/.jpg" alt=" -The above figure