Multiple Choice
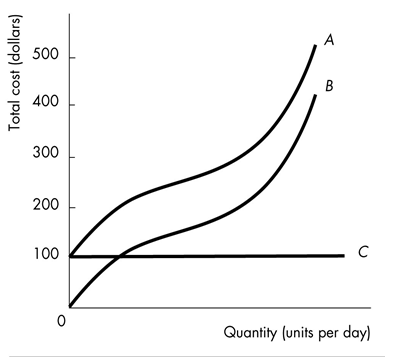
-In the above figure, the relationship between costs indicates that the distance between curves
A) A and B is equal to the fixed cost.
B) A and B is equal to the variable cost.
C) B and C is equal to the fixed cost.
D) B and C is equal to the average total cost.
Correct Answer:

Verified
Correct Answer:
Verified
Q1: If as output increases average product increases,
Q2: <img src="https://d2lvgg3v3hfg70.cloudfront.net/TB8586/.jpg" alt=" -Based on the
Q3: <img src="https://d2lvgg3v3hfg70.cloudfront.net/TB8586/.jpg" alt=" -Based on the
Q5: A firm's average variable cost is $90,
Q6: A firm's total product curve shows that
Q7: Cost schedule<br> <img src="https://d2lvgg3v3hfg70.cloudfront.net/TB8586/.jpg" alt="Cost schedule
Q8: <img src="https://d2lvgg3v3hfg70.cloudfront.net/TB8586/.jpg" alt=" -Cindy's Sweaters' production
Q9: <img src="https://d2lvgg3v3hfg70.cloudfront.net/TB8586/.jpg" alt=" -The above table
Q10: Most total product curves have<br>A) first increasing
Q11: Marginal cost _ as the quantity produced