Multiple Choice
Figure 17-1 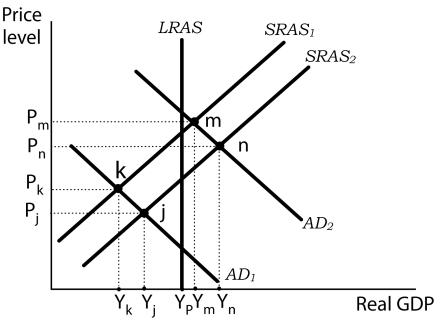
-Refer to Figure 17-1. During the Great Depression, aggregate demand declined sharply, thrusting the economy into a recessionary gap. Nominal wages plunged roughly 20% between 1929 and 1933. How did the economy respond to the falling wages?
A) The short-run aggregate supply curve shifted left, from SRAS2 to SRAS1, resulting in a short run equilibrium at point k.
B) The short-run aggregate supply curve shifted right, from SRAS1 to SRAS2, resulting in a short run equilibrium at point n.
C) The short-run aggregate supply curve shifted right, from SRAS1 to SRAS2, resulting in a short run equilibrium at point j.
D) The short-run aggregate supply curve shifted left, from SRAS2 to SRAS1, resulting in a short run equilibrium at point m.
Correct Answer:

Verified
Correct Answer:
Verified
Q10: In the 1970s the U.S. economy experienced
Q11: According to new classical economics, individuals will
Q12: In the 1970s, the U.S. economy experienced
Q13: The experience of the Great Depression led
Q17: In the initial stages of the Great
Q60: If the economy's short-run aggregate supply curve
Q71: Suppose the economy is initially in long-run
Q114: The monetarists school of economics believes that
Q115: In developing his macroeconomic theory, Keynes<br>A) focused
Q122: What are the main arguments in favor