Multiple Choice
Figure 16-3
Panel (a) Panel (b) 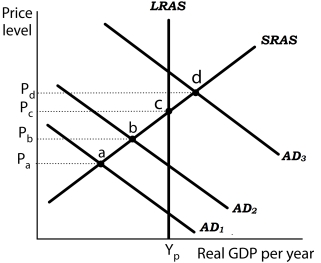
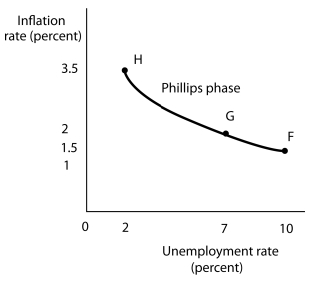 Suppose the level of potential output (YP) is $1,000 billion and the natural rate of unemployment is 5%. In Panel (a) , the aggregate demand curve in Period 1 is AD1. Assume that the price level in Period 1 has risen by 1.5% from the previous period and the unemployment rate is 10%. Thus, in Panel (b) point F shows an initial rate of inflation of 1.5% and an unemployment rate of 10%. Similarly, point b in Panel (a) corresponds to point G in Panel (b) and point d in Panel (a) corresponds to point H in Panel (b) .
-Refer to Figure 16-3. The Phillips phase of the inflation-unemployment cycle is explained
A) by a stagnant short-run aggregate supply curve.
B) by leftward shifts of the aggregate demand curve in each successive period.
C) by upward shifts along the LRAS curve in each successive period.
D) by rightward shifts of the aggregate demand curve in each successive period.
Correct Answer:

Verified
Correct Answer:
Verified
Q43: Frictional unemployment exists because<br>A) the quantity demanded
Q59: Which of the following predictions can be
Q69: In a recovery phase, a falling inflation
Q71: The Phillips phase of the inflation-unemployment relationship
Q74: In the equation of exchange, if velocity
Q97: The relationship between inflation and unemployment suggested
Q100: A Phillips phase emerges because wages are<br>Jflexible
Q104: In the long-run, only a change in
Q107: Evidence suggests that all countries with very
Q113: Falling inflation means<br>A) that the price level