Multiple Choice
Figure 16-3
Panel (a) Panel (b) 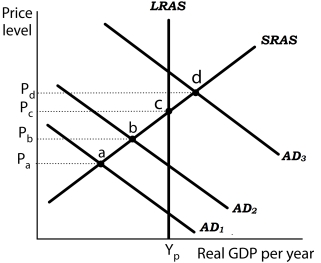
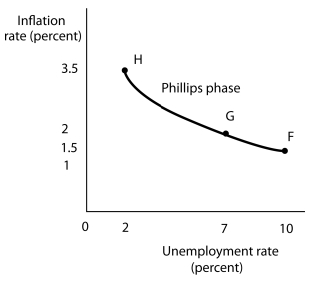 Suppose the level of potential output (YP) is $1,000 billion and the natural rate of unemployment is 5%. In Panel (a) , the aggregate demand curve in Period 1 is AD1. Assume that the price level in Period 1 has risen by 1.5% from the previous period and the unemployment rate is 10%. Thus, in Panel (b) point F shows an initial rate of inflation of 1.5% and an unemployment rate of 10%. Similarly, point b in Panel (a) corresponds to point G in Panel (b) and point d in Panel (a) corresponds to point H in Panel (b) .
-Refer to Figure 16-3. Suppose the economy is operating at point a. What happens if Jpolicymakers undertake expansionary policies in period 1?
A) Aggregate demand in period 2 shifts to AD2 and the new combination of inflation and unemployment rates for period 2 is given by point G.
B) Aggregate demand shifts until point c in panel (a) is reached and the unemployment rate for period 2 is the natural rate.
C) Aggregate demand in period 2 shifts to AD2 and the new combination of inflation and unemployment rates for period 2 is given by point H.
D) Aggregate demand in period 2 shifts to AD3 and the new combination of inflation and unemployment rates for period 2 is given by point H.
Correct Answer:

Verified
Correct Answer:
Verified
Q17: Suppose the full-employment level of real GDP
Q26: Figure 16-7 <img src="https://d2lvgg3v3hfg70.cloudfront.net/TB5507/.jpg" alt="Figure 16-7
Q30: Prior to the 1970s, the model of
Q34: Figure 16-7 <img src="https://d2lvgg3v3hfg70.cloudfront.net/TB5507/.jpg" alt="Figure 16-7
Q36: Figure 16-6 <img src="https://d2lvgg3v3hfg70.cloudfront.net/TB5507/.jpg" alt="Figure 16-6
Q47: A period characterized by declining inflation and
Q57: Which of the following predictions can be
Q67: The inflation rate can be measured as<br>A)
Q102: In the recovery phase of the inflation-unemployment
Q109: If the efficiency wage theory holds,<br>A) wage