Multiple Choice
Figure 16-7 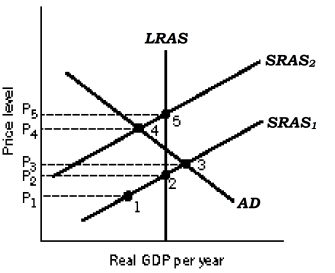
-Refer to Figure 16-7. Over time, the aggregate supply curve shifts from SRAS1 to SRAS2 Jbecause of
A) rising output prices.
B) economic agents adjust their expectations regarding prices and wages downwards.
C) a fall in nominal wages.
D) economic agents adjust their expectations regarding prices and wages upwards.
Correct Answer:

Verified
Correct Answer:
Verified
Q27: In the long run, unemployment will be
Q64: Which of the following characterizes the relationship
Q65: Consider the following statement: "President Carter expressed
Q66: Figure 16-2 <img src="https://d2lvgg3v3hfg70.cloudfront.net/TB5507/.jpg" alt="Figure 16-2
Q68: A Phillips phase of the inflation-unemployment relationship
Q71: Figure 16-7 <img src="https://d2lvgg3v3hfg70.cloudfront.net/TB5507/.jpg" alt="Figure 16-7
Q72: Figure 16-1 <img src="https://d2lvgg3v3hfg70.cloudfront.net/TB5507/.jpg" alt="Figure 16-1
Q73: Figure 16-7 <img src="https://d2lvgg3v3hfg70.cloudfront.net/TB5507/.jpg" alt="Figure 16-7
Q86: The efficiency-wage theory predicts that<br>A) profit-maximizing firms
Q110: Structural unemployment exists because<br>A) workers may not