Multiple Choice
Figure 13-1 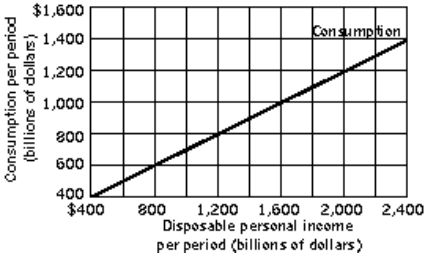
-Refer to Figure 13-1. The marginal propensity to save is
A) 0.25.
B) 0.50.
C) 0.60.
D) cannot be determined without a savings function.
Correct Answer:

Verified
Correct Answer:
Verified
Q38: If consumption is $80 billion when income
Q58: The marginal propensity to consume is the<br>A)
Q154: Figure 13-2 <img src="https://d2lvgg3v3hfg70.cloudfront.net/TB5507/.jpg" alt="Figure 13-2
Q160: Table 13-2<br> <img src="https://d2lvgg3v3hfg70.cloudfront.net/TB5507/.jpg" alt="Table 13-2
Q161: Table 13-3<br>All figures in billions of base-year
Q162: Difficulty: Medium Figure 13-4 <img src="https://d2lvgg3v3hfg70.cloudfront.net/TB5507/.jpg" alt="Difficulty:
Q163: Consider a simple aggregate expenditure model where
Q164: Consider a simple aggregate expenditure model where
Q196: The saving function expresses the relationship between<br>A)
Q208: Suppose when disposable personal income increases from