Multiple Choice
Figure 13-3 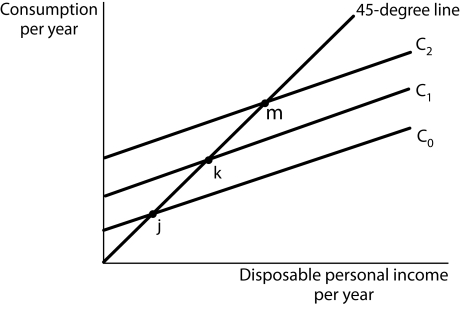
-Refer to Figure 13-3. Upward shifts of the consumption function, for example from C0 to C1 to C2 demonstrate
A) an increase in the marginal propensity to save.
B) increases in the amount of consumption for a given level of disposable income.
C) increases in the amount of disposable income available for consumption.
D) an increase in the marginal propensity to save
Correct Answer:

Verified
Correct Answer:
Verified
Q14: An increase in the slope of the
Q15: Let AE = Aggregate Expenditures, C =
Q17: Figure 13-6 <img src="https://d2lvgg3v3hfg70.cloudfront.net/TB5507/.jpg" alt="Figure 13-6
Q18: Figure 13-1 <img src="https://d2lvgg3v3hfg70.cloudfront.net/TB5507/.jpg" alt="Figure 13-1
Q27: Suppose that your annual income has averaged
Q40: Consider a simple aggregate expenditure model where
Q65: If the economy spends 80% of any
Q156: In the simple aggregate expenditure model where
Q191: Investment equals<br>A) planned investment plus unplanned investment.<br>B)
Q217: The relationship between personal saving and the