Multiple Choice
Figure 7-6 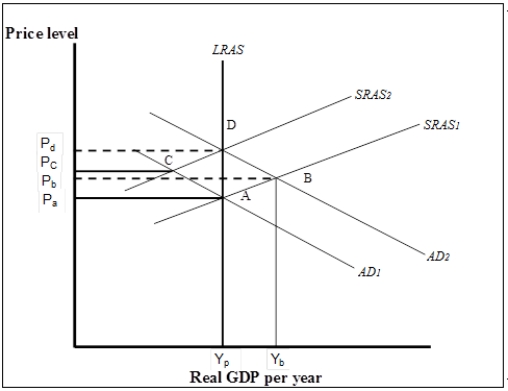
-Refer to Figure 7-6. Suppose the economy is initially at point A. Now suppose an increase in government purchases shifts the aggregate demand curve to AD2. Which of the following statements best explains how the economy responds to restore long-run macroeconomic equilibrium?
A) The increase in the price level to Pb reduces real GDP demanded, shifting the aggregate demand curve back to AD1, returning the economy to its potential output at A.
B) Firms produce more in anticipation of future higher prices, thus shifting the SRAS curve upward until the gap is eliminated at D.
C) Firms and workers will negotiate higher nominal wages to restore lost purchasing power. This shifts the SRAS curve to the left until the gap is eliminated at D.
D) The increase in the price level to Pb decreases consumption which in turn leads firms to cut production shifting the SRAS curve to the left until the gap is eliminated at D.
Correct Answer:

Verified
Correct Answer:
Verified
Q15: Figure 7-6 <img src="https://d2lvgg3v3hfg70.cloudfront.net/TB5507/.jpg" alt="Figure 7-6
Q18: Figure 7-3 <img src="https://d2lvgg3v3hfg70.cloudfront.net/TB5507/.jpg" alt="Figure 7-3
Q21: Table 7-1<br> <img src="https://d2lvgg3v3hfg70.cloudfront.net/TB5507/.jpg" alt="Table 7-1
Q38: The use of government purchases, transfer payments,
Q50: What is the difference between a change
Q53: The potential level of real GDP is
Q59: Which of the following best explains why
Q65: Which of the following is false about
Q112: To eliminate a recessionary gap, policy-makers may
Q117: In the short run, the equilibrium price