Multiple Choice
Exhibit 2A-1 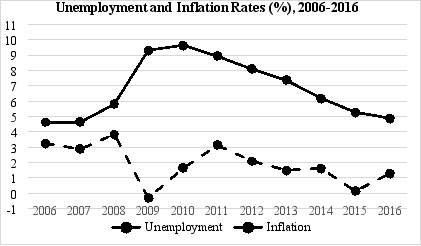
-Exhibit 2A-1 is an example of a
A) bar chart.
B) scatter diagram.
C) pie chart.
D) time-series plot.
E) dual-scale diagram
Correct Answer:

Verified
Correct Answer:
Verified
Related Questions
Q120: If two variables are correlated, then it
Q121: Consider a straight line with a slope
Q122: Those who support a laissez faire system<br>A)believe
Q123: Economic models differ from those in the
Q124: Graph the relationship between X and Y
Q126: The figure below shows the relationship of
Q127: Whether a nation should have more or
Q128: The category of economics that contains statements
Q129: Exhibit 2A-6 <img src="https://d2lvgg3v3hfg70.cloudfront.net/TB6906/.jpg" alt="Exhibit 2A-6
Q130: A laissez faire system is an economy