Multiple Choice
Exhibit 2A-6 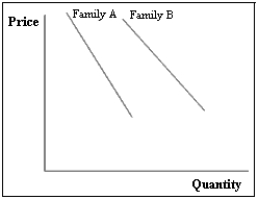
-Exhibit 2A-6 shows the relationship between the price of sodas and the quantities that two families are willing to buy. Suppose that both families are willing to buy more sodas while the soda price remain constant. Which of the following is correct?
A) A shift of both curves to the right
B) A shift of both curves to the left
C) A shift of the curve for Family A to the right and a shift of the curve for Family B to the left
D) A shift of the curve for Family B to the right and a shift of the curve for Family A to the left
E) A movement along each of the two curves
Correct Answer:

Verified
Correct Answer:
Verified
Q124: Graph the relationship between X and Y
Q125: Exhibit 2A-1 <img src="https://d2lvgg3v3hfg70.cloudfront.net/TB6906/.jpg" alt="Exhibit 2A-1
Q126: The figure below shows the relationship of
Q127: Whether a nation should have more or
Q128: The category of economics that contains statements
Q130: A laissez faire system is an economy
Q131: A major reason for the development of
Q132: A relationship showing that exam grades are
Q133: "Inflation is a more serious problem than
Q134: Exhibit 2A-3 <img src="https://d2lvgg3v3hfg70.cloudfront.net/TB6906/.jpg" alt="Exhibit 2A-3