Essay
Refer to the table below, which shows data for the United States. 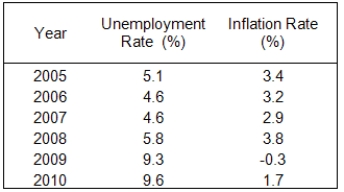

Correct Answer:

Verified
Correct Answer:
Verified
Q26: Graph the relationship between X and Y
Q29: Explain the purpose of each of the
Q34: Exhibit 2A-2 <img src="https://d2lvgg3v3hfg70.cloudfront.net/TB6906/.jpg" alt="Exhibit 2A-2
Q49: An inverse relationship between two variables indicates
Q60: Exhibit 2A-5<br> <img src="https://d2lvgg3v3hfg70.cloudfront.net/TB6906/.jpg" alt="Exhibit 2A-5
Q62: Exhibit 2A-3 <img src="https://d2lvgg3v3hfg70.cloudfront.net/TB6906/.jpg" alt="Exhibit 2A-3
Q86: Exhibit 2A-3 <img src="https://d2lvgg3v3hfg70.cloudfront.net/TB6906/.jpg" alt="Exhibit 2A-3
Q90: Exhibit 2A-1 <img src="https://d2lvgg3v3hfg70.cloudfront.net/TB6906/.jpg" alt="Exhibit 2A-1
Q117: Exhibit 2A-2 <img src="https://d2lvgg3v3hfg70.cloudfront.net/TB6906/.jpg" alt="Exhibit 2A-2
Q121: Consider a straight line with a slope