Essay
The figure below shows the relationship of the quantity demanded for coffee beans to the price of coffee beans at a local coffee shop. 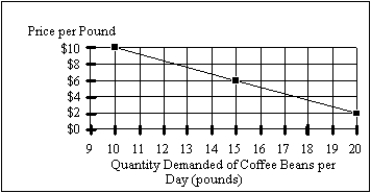

Correct Answer:

Verified
Correct Answer:
Verified
Q2: Economic models need to resemble, as much
Q27: To see whether the price of gasoline
Q64: Exhibit 2-3<br> <img src="https://d2lvgg3v3hfg70.cloudfront.net/TB6906/.jpg" alt="Exhibit 2-3
Q74: Exhibit 2-3<br> <img src="https://d2lvgg3v3hfg70.cloudfront.net/TB6906/.jpg" alt="Exhibit 2-3
Q84: Which of the following statements is true?<br>A)Normative
Q88: Refer to the information in the following
Q93: Economic data always give an accurate picture
Q100: A good explanation for why people believe
Q106: Exhibit 2-3<br> <img src="https://d2lvgg3v3hfg70.cloudfront.net/TB6906/.jpg" alt="Exhibit 2-3
Q142: An economic model is the same as