Multiple Choice
Refer to the accompanying graphs to answer the questions.
Graph A 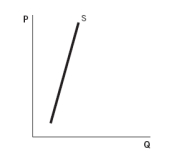 Graph B
 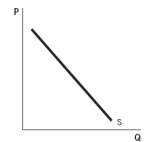 Graph C
 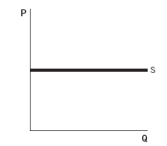 Graph D
 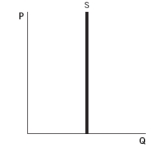 Graph E
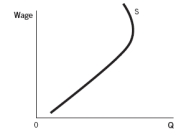
-Which graph shows a person who has a fixed quantity of hours that she is willing to work per week?
A) Graph A
B) Graph B
C) Graph C
D) Graph D
E) Graph E
Correct Answer:

Verified
Correct Answer:
Verified
Q12: Refer to the following table to answer
Q17: Mary decides that worker turnover is too
Q57: The following graph represents Zendar's labor market.Use
Q62: If the price of pencils falls,the marginal
Q85: The citizens of Kingsville notice that their
Q86: A formerly quiet town with fantastic weather
Q92: The earth's major governments have recently decided
Q107: Amy just applied for a position with
Q158: Companies outsource their operations because<br>A) the weather
Q167: Labor supply is the relationship between<br>A) wages