Multiple Choice
The following graph represents Zendar's labor market.Use this graph to answer the following questions:
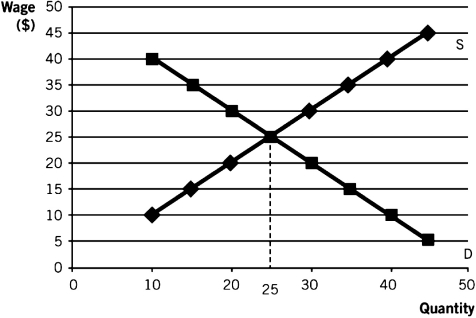
-To have no surplus or shortage of workers in Zendar,what does the wage rate have to be?
A) $5
B) $10
C) $15
D) $20
E) $25
Correct Answer:

Verified
Correct Answer:
Verified
Related Questions
Q114: The following table includes information on the
Q115: The labor supply curve is given by
Q116: If there is a massive wave of
Q117: Joe has several different offers for his
Q118: The income effect describes the<br>A) incentive to
Q120: The backward-bending labor supply curve has its
Q121: About what percent of the U.S.income is
Q122: The following graph represents Zendar's labor market.Use
Q123: Derived demand best describes the demand for
Q124: Use the following table,which shows the supply