Multiple Choice
The graph in the figure shows the force on an object as a function of the elongation caused by that force.Which statement about this object is true? 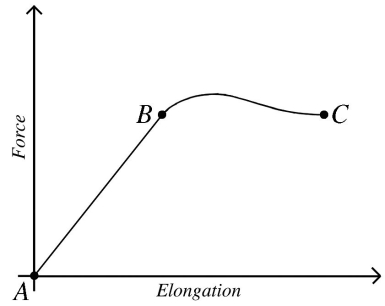
A) The object obeys Hooke's law at all points from A to C.
B) The object obeys Hooke's law at all points from B to C.
C) The object obeys Hooke's law at all points from A to B.
D) The elastic limit occurs at point C.
E) The region of elastic behavior occurs from B to C.
Correct Answer:

Verified
Correct Answer:
Verified
Q1: A cubical box,5.00 cm on each side,is
Q21: Salt water is more dense than fresh
Q23: The two water reservoirs shown in the
Q24: Consider a very small hole in the
Q27: In the figure,an open tank contains a
Q31: Water is flowing in a horizontal pipe
Q38: Tensile stress is<br>A) the strain per unit
Q40: Water flows through a pipe having a
Q45: A 12,000-N car is raised using a
Q47: A rock is under water in a