Short Answer
The graph in the figure shows the x component of the acceleration of a 2.4-kg object as a function of time (in ms). 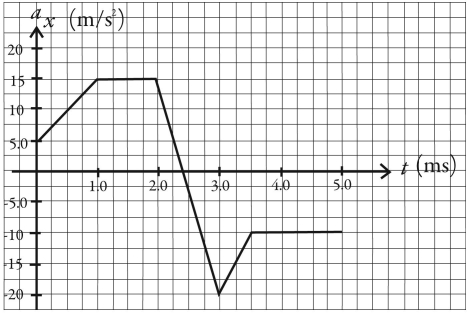 (a)At what time(s)does the x component of the net force on the object reach its maximum magnitude,and what is that maximum magnitude?
(b)What is the x component of the net force on the object at time t = 0.0 ms and at t = 4.0 ms?
Correct Answer:

Verified
(a)At 3.0 ...View Answer
Unlock this answer now
Get Access to more Verified Answers free of charge
Correct Answer:
Verified
View Answer
Unlock this answer now
Get Access to more Verified Answers free of charge
Q2: A car is being towed at constant
Q6: You are seated in a bus and
Q16: Which one of the following free-body diagrams
Q23: The figure shows a graph of the
Q42: A dog is standing in the bed
Q44: A stalled car is being pushed up
Q54: A 615 N student standing on a
Q78: A crate is sliding down an inclined
Q92: Suppose the force of the air drag
Q94: A woman is straining to lift a