Multiple Choice
The figure shows the graph of the position x as a function of time for an object moving in the straight line (the x-axis) .Which of the following graphs best describes the velocity along the x-axis as a function of time for this object? 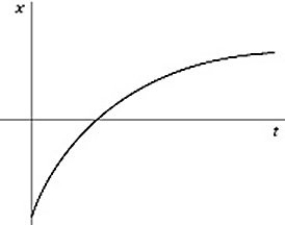
A) 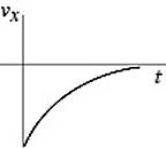
B) 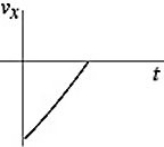
C) 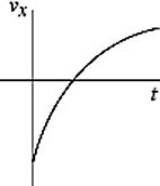
D) 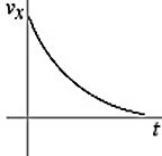
E) 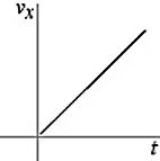
Correct Answer:

Verified
Correct Answer:
Verified
Related Questions
Q5: A rocket takes off vertically from the
Q27: A test rocket is fired straight up
Q28: A rock is thrown directly upward from
Q33: A ball is thrown directly upward and
Q38: The velocity of an object as a
Q39: A toy rocket is launched vertically from
Q40: A racing car accelerates uniformly from rest
Q44: The figure represents the position of a
Q47: The motions of a car and a
Q48: A ball is projected upward at time