Short Answer
The figure shows a graph of the velocity as a function of time for a basketball player traveling up and down the court in a straight-line path.For the 10 s shown on the graph,find
(a)the net displacement of the player.
(b)the total distance run by the player. 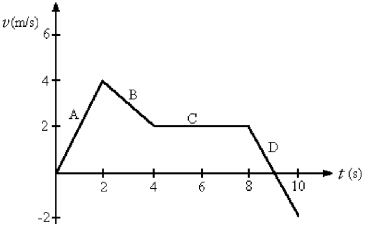
Correct Answer:

Verified
Correct Answer:
Verified
Related Questions
Q27: A test rocket is fired straight up
Q31: An object is moving in a straight
Q32: The position of an object as a
Q33: A ball is projected upward at time
Q34: At the same moment from the top
Q37: If the fastest you can safely drive
Q38: The velocity of an object as a
Q39: A toy rocket is launched vertically from
Q40: A racing car accelerates uniformly from rest
Q50: A runner maintains constant acceleration after starting