Essay
Suppose that each firm in an industry has total costs as shown in the following table. 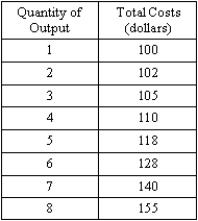 (A)Suppose that the quantity demanded in the market is perfectly inelastic at a quantity of 6. Calculate the average total cost for each firm when there are 1, 2, and 6 firms in the industry. Draw a diagram indicating the relationship between average total cost and the number of firms.
(B)Suppose the quantity demanded in the market expands because of an opening of trade and is now perfectly inelastic at a quantity of 8. Draw a diagram, similar to the one in part (A), indicating the relationship between average total cost and the number of firms. Why does this opening of trade cause this shift in the curve?
(C)What happens to price in the long run? Explain.
Correct Answer:

Verified
(A)  The average total cost when there a...
View Answer
Unlock this answer now
Get Access to more Verified Answers free of charge
Correct Answer:
Verified
View Answer
Unlock this answer now
Get Access to more Verified Answers free of charge
Q15: Central America would most likely have a
Q50: Explain the connection between the relative price
Q54: Exhibit 29-2 <img src="https://d2lvgg3v3hfg70.cloudfront.net/TB6906/.jpg" alt="Exhibit 29-2
Q65: Explain the difference between an export subsidy
Q69: An import tax whose main purpose is
Q103: Exhibit 29-1 <img src="https://d2lvgg3v3hfg70.cloudfront.net/TB6906/.jpg" alt="Exhibit 29-1
Q129: What is unilateral disarmament? Why is unilateral
Q134: Country A and country B both produce
Q137: The Smoot-Hawley tariff demonstrated to the whole
Q147: Explain the connection between opportunity costs of