Essay
The figure below shows the effect of a 2001 increase in government purchases on the hypothetical path of real GDP compared to the path of potential GDP (the baseline) between 2001 and 2005. 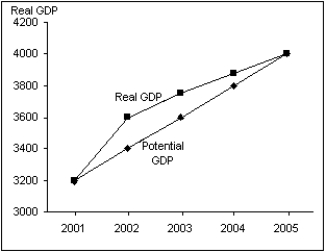 (A)Using the AD curve and IA line analysis, explain what is occurring between 2001 and 2002.
(B)Using the AD curve and IA line analysis, explain what is occurring between 2002 and 2004.
(C)Using the AD curve and IA line analysis, explain what is occurring between 2004 and 2005.
Correct Answer:

Verified
(A)As a result of the increase in govern...View Answer
Unlock this answer now
Get Access to more Verified Answers free of charge
Correct Answer:
Verified
View Answer
Unlock this answer now
Get Access to more Verified Answers free of charge
Q18: If government spending decreases, the long-run income
Q56: If real GDP is below potential GDP,<br>A)long-run
Q71: The United States economy never recovered from
Q87: The best explanation for the recent economic
Q100: What is the difference between a price
Q109: Suppose the economy is initially at potential
Q117: A supply shock is exactly the opposite
Q121: The period from 1979 to 1987 is
Q122: What is the difference between deflation and
Q142: A change in the price of a