Multiple Choice
Exhibit 24-1 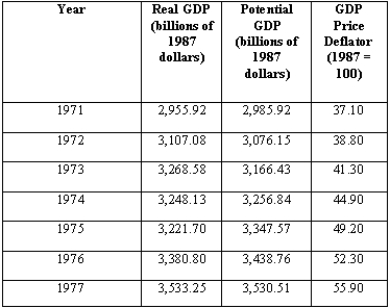
-According to the data in Exhibit 24-1,the percentage deviation of real GDP from potential GDP in 1976 was
A) 1.7 percent.
B) -5.8 percent.
C) 2.7 percent.
D) -4.9 percent.
E) -1.7 percent.
Correct Answer:

Verified
Correct Answer:
Verified
Related Questions
Q19: Exhibit 24-6 <img src="https://d2lvgg3v3hfg70.cloudfront.net/TB6035/.jpg" alt="Exhibit 24-6
Q29: Which of the following would cause the
Q74: If the nominal interest rate exceeds the
Q77: Assuming constant inflation, a shift of the
Q98: The slope of the monetary policy rule
Q99: When real and potential GDP are equal,<br>A)prices
Q173: Since changes in both monetary policy and
Q197: Explain clearly why the AD curve slopes
Q198: According to the spending allocation model, what
Q204: When the Fed raises interest rates, it