Multiple Choice
Exhibit 2A-2 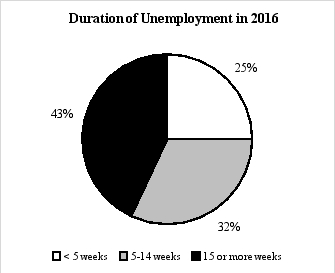
-The type of chart shown in Exhibit 2A-2 is referred to as a
A) dual-scale diagram.
B) time-series graph.
C) bar chart.
D) pie chart.
E) scatter diagram.
Correct Answer:

Verified
Correct Answer:
Verified
Q112: A microeconomic model must be much smaller
Q113: To argue that economics is a partisan
Q114: Exhibit 2A-2 <img src="https://d2lvgg3v3hfg70.cloudfront.net/TB6906/.jpg" alt="Exhibit 2A-2
Q115: What is the difference between correlation and
Q116: What problems would arise if economists did
Q118: Exhibit 2A-8 <img src="https://d2lvgg3v3hfg70.cloudfront.net/TB6906/.jpg" alt="Exhibit 2A-8
Q119: The ceteris paribus assumption is used in
Q120: If two variables are correlated, then it
Q121: Consider a straight line with a slope
Q122: Those who support a laissez faire system<br>A)believe