Essay
The table shows the price of motor fuel (mainly gasoline) and the overall price level (the consumer price index) in five-year intervals over the period 1970 through 1990. 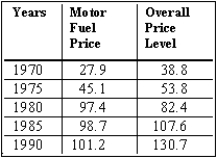 (A)Plot a diagram of the relative price of motor fuel for the 1970-1990 period.
(B)Explain what has been happening to the relative price of motor fuel over this period.
Correct Answer:

Verified
(A)The plot of the diagram is shown in t...View Answer
Unlock this answer now
Get Access to more Verified Answers free of charge
Correct Answer:
Verified
View Answer
Unlock this answer now
Get Access to more Verified Answers free of charge
Q4: The ceteris paribus, or everything else held
Q11: A hypothesis is<br>A)an alternative to using models.<br>B)a
Q24: Economics requires more of a mixture of
Q27: To see whether the price of gasoline
Q46: If we observe that an increase in
Q76: All of the following are examples of
Q87: Consider an economic model of CD production.
Q101: Which of the following is not an
Q106: Identify whether the following issues are macroeconomic
Q116: What problems would arise if economists did