Essay
The figure below shows the relationship of the quantity demanded for coffee beans to the price of coffee beans at a local coffee shop. 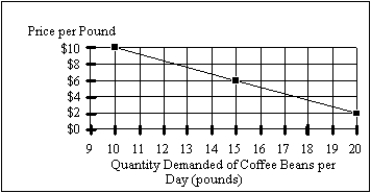 (A)If the price of coffee increases from $6 per pound to $10 per pound, by how much will the quantity demanded for coffee change?
(B)Explain how your answer in part (A) relies on the ceteris paribus assumption.
Correct Answer:

Verified
(A)The daily demand for coffee will decl...View Answer
Unlock this answer now
Get Access to more Verified Answers free of charge
Correct Answer:
Verified
View Answer
Unlock this answer now
Get Access to more Verified Answers free of charge
Q2: Economic models need to resemble, as much
Q3: For policy decisions to be useful,<br>A)political issues
Q4: "Inflation is currently 4 percent in the
Q23: Whether to have more or less government
Q38: Positive economics<br>A)will usually indicate which economic policy
Q47: Two variables are correlated if<br>A)they both move
Q50: A model is valid if<br>A)it is based
Q65: If the quantity demanded of coffee increases
Q89: All of the following are what economists
Q115: What is the difference between correlation and