Multiple Choice
Refer to the information provided in Figure 5.7 below to answer the question(s) that follow. 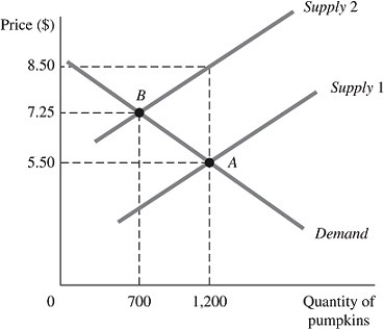 Figure 5.7
The above figure represents the market for pumpkins both before and after the imposition of an excise tax, which is represented by the shift of the supply curve.
-Refer to Figure 5.7. After the tax, store owners are willing to sell ________ pumpkins at a price of ________ each.
A) 1,200; $5.50
B) 700; $7.25
C) 0; $8.50
D) 1,200; $7.25
Correct Answer:

Verified
Correct Answer:
Verified
Q157: If the quantity of bagels demanded decreases
Q158: The less time that elapses, the<br>A) less
Q159: When there are more substitutes for a
Q160: Price and total revenue move in inverse
Q161: Refer to the information provided in Figure
Q163: At a price of $20, a store
Q164: When demand is inelastic, a decrease in
Q165: A government is considering levying an alcohol
Q166: Related to the Economics in Practice on
Q167: Refer to the information provided in Figure