Multiple Choice
Refer to the information provided in Figure 5.7 below to answer the question(s) that follow. 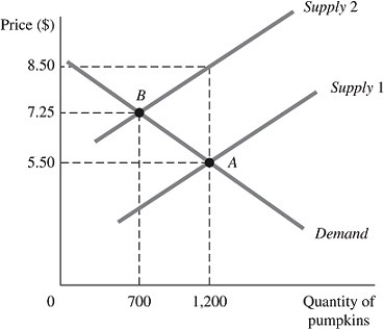 Figure 5.7
The above figure represents the market for pumpkins both before and after the imposition of an excise tax, which is represented by the shift of the supply curve.
-Refer to Figure 5.7. The amount of the tax is ________ per pumpkin.
A) $1.25
B) $1.75
C) $3.00
D) $7.25
Correct Answer:

Verified
Correct Answer:
Verified
Q98: The income elasticity of demand for education
Q99: Refer to the information provided in Figure
Q100: If income increases by 10% and, in
Q101: The owner of a local pretzel cart
Q102: Refer to the information provided in Figure
Q104: A demand curve with continuously changing slope
Q105: When the price of fresh fish increases
Q106: Refer to the information provided in Figure
Q107: If a decrease in income results in
Q108: Which of the following, if true, would