Multiple Choice
Refer to the information provided in Figure 5.7 below to answer the question(s) that follow. 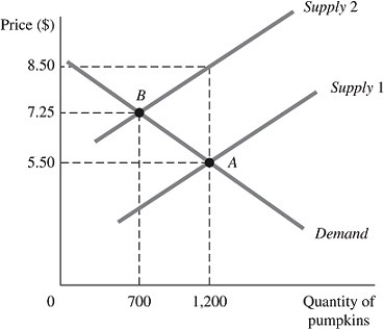 Figure 5.7
The above figure represents the market for pumpkins both before and after the imposition of an excise tax, which is represented by the shift of the supply curve.
-Refer to Figure 5.7. The amount customers will pay per pumpkin after the imposition of the tax is
A) $1.75.
B) $3.00.
C) $4.25.
D) $7.25.
Correct Answer:

Verified
Correct Answer:
Verified
Q77: If the supply of oranges is unit
Q80: Refer to the information provided in Figure
Q81: The income elasticity of demand for low-quality
Q82: A perfectly price elastic supply curve will
Q83: If a firm wants to increase revenue,
Q84: If an increase in income results in
Q86: A tax on a good whose demand
Q87: Normal goods will experience decreasing demand when
Q89: Perfectly elastic demand is represented as a
Q90: Refer to the information provided in Figure