Multiple Choice
Refer to the information provided in Figure 5.7 below to answer the question(s) that follow. 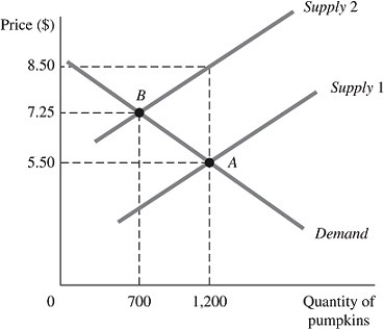 Figure 5.7
The above figure represents the market for pumpkins both before and after the imposition of an excise tax, which is represented by the shift of the supply curve.
-Refer to Figure 5.7. The demand for pumpkins from the equilibrium point before the imposition of the tax to the equilibrium point after the imposition of the tax is
A) elastic.
B) inelastic.
C) unit elastic.
D) perfectly elastic.
Correct Answer:

Verified
Correct Answer:
Verified
Q46: Price and total revenue are inversely related
Q47: Demand determines _ entirely when _ is
Q48: If the quantity of pretzels demanded decreases
Q49: When the price of cheddar cheese increases
Q50: Luxury items tend to have _ demand,
Q52: A negative income elasticity implies that the
Q53: Refer to the information provided in Figure
Q54: How total revenue changes when a price
Q55: When demand is inelastic, a decrease in
Q56: At a price of $40, a store