Multiple Choice
Refer to the information provided in Figure 5.7 below to answer the question(s) that follow. 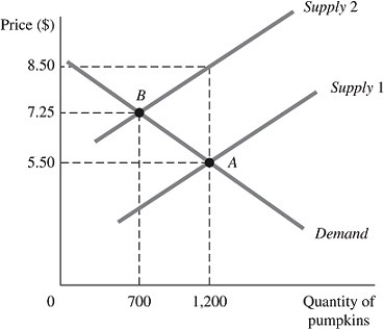 Figure 5.7
The above figure represents the market for pumpkins both before and after the imposition of an excise tax, which is represented by the shift of the supply curve.
-Refer to Figure 5.7. Had the demand for pumpkins been perfectly inelastic at Point A, the total revenue the government would have received from the imposition of this tax would have been
A) $875.
B) $1,225.
C) $2,100.
D) $3,600.
Correct Answer:

Verified
Correct Answer:
Verified
Q77: If the supply of oranges is unit
Q85: Refer to the information provided in Figure
Q86: A tax on a good whose demand
Q87: Normal goods will experience decreasing demand when
Q89: Perfectly elastic demand is represented as a
Q91: At a price of $4, quantity supplied
Q92: The determinants of elasticity include<br>A) availability of
Q93: Point elasticity is a measure of elasticity
Q94: On a downward-sloping linear demand curve, demand
Q95: When the price of coffee increases 5%,