Multiple Choice
Refer to the information provided in Figure 28.4 below to answer the question(s) that follow. 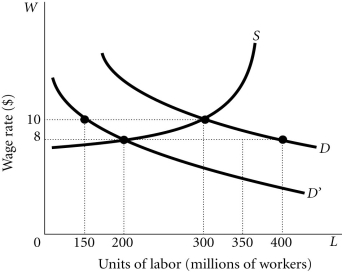 Figure 28.4
-Refer to Figure 28.4. Suppose there is a decrease in the fertility rate and this causes some men and women to place a lower value on their time spent in nonmarket activities. This will cause
A) the labor supply curve to shift to the left of S.
B) the labor supply curve to shift to the right of S.
C) the labor demand curve to shift from D to D'.
D) the labor demand curve to shift from D' to D.
Correct Answer:

Verified
Correct Answer:
Verified
Q47: If the economy is at potential output,
Q61: Cyclical unemployment<br>A) arises from recessions.<br>B) is due
Q76: Suppose the wage rate in the labor
Q124: Refer to the information provided in Figure
Q130: Which of the following is not a
Q133: Refer to the information provided in Figure
Q151: Structural unemployment<br>A) arises from recessions.<br>B) is due
Q229: The unemployment rate will never be zero
Q250: When _, the price level falls, inventories
Q254: The shape of the short run aggregate