Multiple Choice
Refer to the information provided in Figure 26.2 below to answer the question(s) that follow. 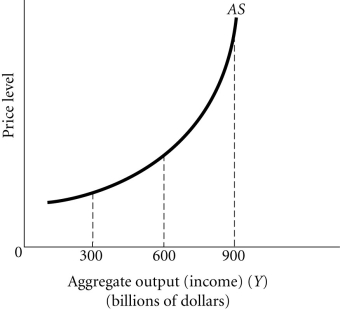 Figure 26.2
-Refer to Figure 26.2. Between the output levels of $600 billion and $900 billion, the relationship between the price level and output is
A) negative.
B) positive.
C) constant.
D) There is no relationship between the price level and output.
Correct Answer:

Verified
Correct Answer:
Verified
Q2: When the interest rate is high, planned
Q20: Refer to the information provided in Figure
Q23: Refer to the information provided in Figure
Q41: Which of the following causes a movement
Q55: To decrease output the government could adopt
Q70: If the price level falls, the aggregate
Q83: If the combination r = 5% and
Q130: When the general price level falls<br>A) consumption
Q207: A decrease in government spending will decrease
Q221: The IS curve shows combinations of output