Multiple Choice
Refer to the graph below.The Keeling curve,shown here,provides us with more than a half-century of precise measurements of atmospheric CO2 concentrations over Mauna Loa,Hawaii.Do these data show a trend,and if so,what is the trend? 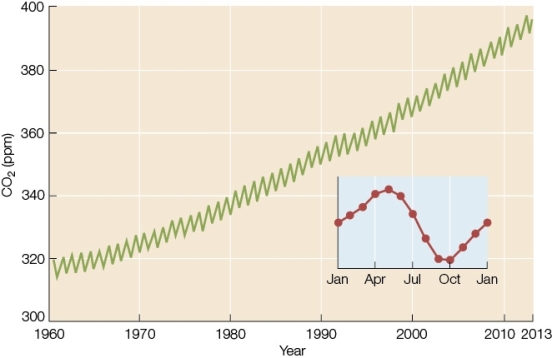
A) No;the data appear random.
B) No;the data show constant variability,not a definite trend.
C) Yes;the data show a slight,but insignificant,upward trend.
D) Yes;the data show an upward trend,but variability makes it invalid.
E) Yes;the data show a definite upward trend with predictable seasonal variations.
Correct Answer:

Verified
Correct Answer:
Verified
Q94: A bird species responds to earlier spring
Q95: An insect pollinator emerges on May 1,but
Q96: The Indian pipe plant,Monotropa uniflora,lacks chlorophyll and
Q97: Most organisms are unable to break down
Q98: Based on studies of leaf-cutter ants,in which
Q100: In general, given sufficient precipitation, what relationship
Q101: Which sequence represents the correct size
Q102: Which of these regions of Earth is
Q103: Runoff of high- nitrogen substances,such as fertilizer
Q104: How are warming temperatures likely to affect