Multiple Choice
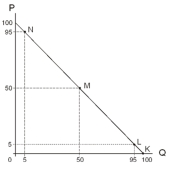
-The demand curve shown in the diagram above can be expressed as
A) P = 50 - 50Q.
B) P = 100 - Q.
C) P = 100 - 100Q.
D) Q = 100 - 100P.
E) Q = 100 - K.
Correct Answer:

Verified
Correct Answer:
Verified
Related Questions
Q55: <img src="https://d2lvgg3v3hfg70.cloudfront.net/TB3714/.jpg" alt=" -Refer to the
Q56: Consumers who buy luxury cars seldom pay
Q57: If the demand curve for beets is
Q58: The local electricity utility wants to increase
Q59: The rational spending rule is derived from
Q61: Assume that consumers in both Alberta and
Q62: <img src="https://d2lvgg3v3hfg70.cloudfront.net/TB3714/.jpg" alt=" -Refer to the
Q63: A cross-price elasticity of 0.83 indicates the
Q64: The income elasticity of demand for chicken
Q65: A price elasticity of demand of 0.3