Multiple Choice
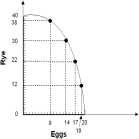
-Refer to the graph above.The graph indicates that,as more eggs are produced,the opportunity cost of producing eggs
A) increases
B) remains constant.
C) decreases.
D) is not defined.
E) is zero.
Correct Answer:

Verified
Correct Answer:
Verified
Q29: Jane can produce 50 pizzas or 100
Q35: <img src="https://d2lvgg3v3hfg70.cloudfront.net/TB3713/.jpg" alt=" -As the store
Q53: If there were decreasing opportunity costs,then the
Q69: <img src="https://d2lvgg3v3hfg70.cloudfront.net/TB3713/.jpg" alt=" -If all three
Q72: An existing comparative advantage can be increased
Q115: The slope of an individual's production possibilities
Q116: Application of the Principle of Comparative Advantage
Q119: An isolated economy<br>A) is less likely than
Q124: For a nation that finds it has
Q130: Suppose that a further increase in specialization