Multiple Choice
 This diagram shows the costs incurred by firm A and firm B as they reduce the pollution from their factories.MACA represents the marginal abatement cost for firm A and MACB represents the marginal abatement cost for firm B.
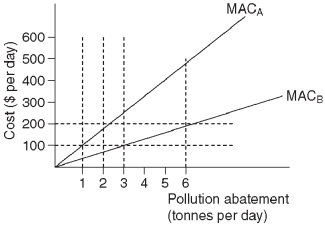
-Refer to the diagram above.Suppose that the government imposes a tax of $200 per tonne of pollution per day.As a result,firm A will reduce pollution by _______ tonne(s) per day and firm B will reduce pollution by _________ tonne(s) per day.
A) 1;3
B) 3;1
C) 2;6
D) 6;2
E) 3;3
Correct Answer:

Verified
Correct Answer:
Verified
Q29: A positional externality<br>A) can only occur in
Q30: The following data show the relationship between
Q31: If a positive externality exists in the
Q32: Compared to a fixed-percentage reduction regulation,a tax
Q33: A resource that has private property rights
Q35: Refer to the graph below. <img src="https://d2lvgg3v3hfg70.cloudfront.net/TB3714/.jpg"
Q36: Which of the following would NOT be
Q37: Steve and Don are neighbours who work
Q38: If the external benefit of an activity
Q39: Paul owns a home on the top