Essay
A quality analyst wants to construct a sample mean chart for controlling a packaging process.He knows from past experience that the process standard deviation is two ounces.Each day last week,he randomly selected four packages and weighed each.The data from that activity appear below.
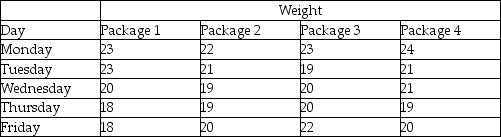 (a)Calculate all sample means and the mean of all sample means.
(b)Calculate upper and lower 2-sigma x-bar chart control limits that allow for natural variations.
(c)Based on the x-bar chart,is this process in control?
Correct Answer:

Verified
(a)The five sample means are 23,21,20,19...View Answer
Unlock this answer now
Get Access to more Verified Answers free of charge
Correct Answer:
Verified
View Answer
Unlock this answer now
Get Access to more Verified Answers free of charge
Q4: The term _ is used to describe
Q8: A hospital-billing auditor has been inspecting patient
Q45: What are the three possible results (or
Q48: Acceptance sampling:<br>A)may involve inspectors taking random samples
Q50: Consumer's risk is the probability of:<br>A)accepting a
Q73: Acceptance sampling accepts or rejects an entire
Q110: Why do range charts exist? Aren't x-bar
Q128: An operating characteristic (OC)curve describes:<br>A)how many defects
Q227: According to the text, what is the
Q237: An operating characteristics curve shows:<br>A) upper and