Essay
A quality analyst wants to construct a sample mean chart for controlling a packaging process.He knows from past experience that when the process is operating as intended,packaging weight is normally distributed with a mean of twenty ounces,and a process standard deviation of two ounces.Each day last week,he randomly selected four packages and weighed each.The data from that activity appear below.
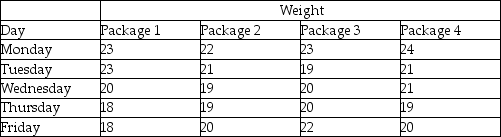 (a)If he sets an upper control limit of 21 and a lower control limit of 19 around the target value of twenty ounces,the control chart is based on what value of z?
(b)With the UCL and LCL of part a,what do you conclude about this process-is it in control?
Correct Answer:

Verified
(a)These control limits are one standard...View Answer
Unlock this answer now
Get Access to more Verified Answers free of charge
Correct Answer:
Verified
View Answer
Unlock this answer now
Get Access to more Verified Answers free of charge
Q11: The C<sub>pk</sub> index measures the difference between
Q23: The probability of rejecting a good lot
Q87: In statistical process control,the range is often
Q87: A nationwide parcel delivery service keeps track
Q91: McDaniel Shipyards wants to develop a control
Q119: Some degree of variability is present in
Q121: Averages of small samples,not individual measurements,are generally
Q230: An x-bar control chart was examined and
Q231: The _ is the percentage defective in
Q257: Briefly explain what the Central Limit Theorem