Multiple Choice
The following table shows the number of U.S. dollars required to buy one Mexican peso and the number of U.S. dollars required to buy one Japanese yen between June 1, 2016, and September 1, 2016. Use this table to answer the following questions. 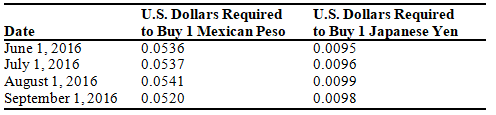
-Between June 1,2016,and July 1,2016,the number of U.S.goods exported to Mexico likely
A) increased because U.S.goods became more expensive to consumers in Mexico.
B) decreased because U.S.goods became more expensive to consumers in Mexico.
C) increased because U.S.goods became less expensive to consumers in Mexico.
D) decreased because U.S.goods became less expensive to consumers in Mexico.
E) did not change because exchange rates do not affect trade.
Correct Answer:

Verified
Correct Answer:
Verified
Q35: Currency appreciation occurs when<br>A) the demand for
Q36: The following two figures depict the demand
Q37: The following table shows the number of
Q38: Consider a situation of two cities linked
Q39: <br>-Suppose that a Sony PlayStation (manufactured in
Q41: Explain the influence of economic growth on
Q42: Pegged exchange rates can also be referred
Q43: Explain how fiscal policy may increase the
Q44: The following graph depicts the market for
Q45: Assume that investment increases but gross domestic