Multiple Choice
What can be concluded from the chart below (which shows inflation versus unemployment rates from 1948 to 2015) ? 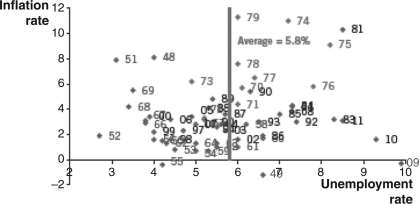
A) In the long run,the Phillips Curve is a robust model.
B) In the short run,unemployment is correlated with inflation.
C) In the long run,unemployment is correlated with inflation.
D) In the short run,unemployment is not always correlated with inflation.
E) In the long run,unemployment is not always correlated with inflation.
Correct Answer:

Verified
Correct Answer:
Verified
Q55: The widespread problems in financial markets during
Q56: Between 1929 and 1933,what triggered a major
Q57: _ policy is when a central bank
Q58: Expansionary monetary policy<br>A) lowers interest rates,causing aggregate
Q59: How did adaptive expectations theory revolutionize the
Q61: Since the early 1980s,the Federal Reserve has
Q62: Changes in the quantity of money lead
Q63: Which of the following explains expansionary monetary
Q64: What happens if aggregate demand decreases simultaneously
Q65: Studying alternative theories of how people form