Multiple Choice
Use the following graph to answer the following questions.The graph depicts an economy where aggregate demand and long-run aggregate supply (LRAS) have decreased,with no change in short-run aggregate supply (SRAS) .
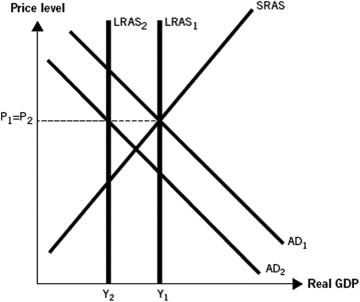
-In the graph,we see that long-run aggregate supply decreased during the Great Recession.This was due to a decline in housing prices and the subsequent financial crisis.Why did these factors cause long-run aggregate supply to decrease?
A) They caused household wealth and expected income to decline.
B) They caused permanent changes in the market for loanable funds.
C) They caused oil and gas prices to increase,causing inflation.
D) They caused unemployment to remain at normal levels.
E) They caused deflation and an increase in the value of the dollar.
Correct Answer:

Verified
Correct Answer:
Verified
Q129: When compared to other recessions,the Great Depression
Q130: Keynesian economists believe that government intervention in
Q131: As a result of several factors,aggregate demand
Q132: Use the following graph to answer the
Q133: Use the image below to explain what
Q135: Use the following graph to answer the
Q136: Keynesian economists believe that more focus should
Q137: Which of the following would have caused
Q138: One similarity between the Great Depression and
Q139: In comparison with other recessions,the Great Depression