Multiple Choice
Use the following graph to answer the following questions.The graph depicts an economy where aggregate demand has decreased.Note that long-run aggregate supply remains changed.
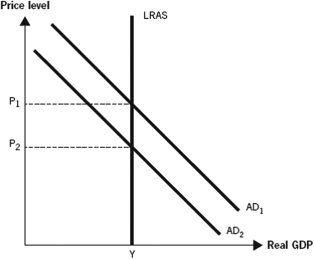
-The graph shows a decrease in the price level due to a decrease in aggregate demand.Real gross domestic product (GDP) ,however,does not change.The best explanation for the events depicted on this graph is that
A) the economy tends to be unstable and experiences high levels of unemployment.
B) most recessions are caused by changes in aggregate supply.
C) changes in aggregate demand are always positive.
D) the government plays a major role in promoting economic stability.
E) the economy quickly adjusts to changes in aggregate demand and remains at full employment.
Correct Answer:

Verified
Correct Answer:
Verified
Q76: The Great Recession began in _ and
Q77: Which of the following best summarizes the
Q78: Classical economists believe that prices are completely
Q79: Keynesian economists believe that<br>A) the long run
Q80: Keynesian economists believe that prices are sticky
Q82: Discuss the features on the graph below
Q83: Use the following graph to answer the
Q84: During the Great Recession,the U.S.long-run aggregate supply
Q85: The Great Recession is characterized by a
Q86: Keynesian economists stress the importance of aggregate