Multiple Choice
The graph below suggests a housing price ________ followed by a(n) ________ in aggregate demand. 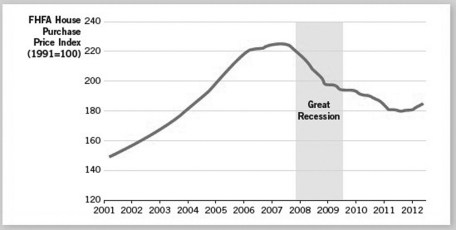
A) glut; decrease
B) bubble; increase
C) bubble; decrease
D) glut; increase
E) assessment; decrease
Correct Answer:

Verified
Correct Answer:
Verified
Related Questions
Q67: In the 1930s,Presidents Hoover and Roosevelt raised
Q68: Use the following graph to answer the
Q69: During the Great Recession,consumer sentiment in the
Q70: Which of the following economic statements would
Q71: If prompted to describe fundamental beliefs about
Q73: The Great Recession ended in<br>A) June 2009.<br>B)
Q74: Monetary policy is<br>A) the set of laws
Q75: When considering the basic operations of the
Q76: The Great Recession began in _ and
Q77: Which of the following best summarizes the