Multiple Choice
Use the following graph to answer the following questions.
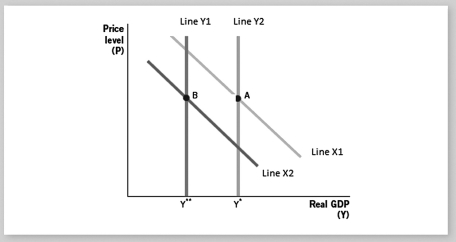
-Lines Y1 and Y2 represent
A) an aggregate demand adjustment.
B) short-run aggregate demand (SRAD) .
C) long-run aggregate demand (LRAD) .
D) short-run aggregate supply (SRAS) .
E) long-run aggregate supply (LRAS) .
Correct Answer:

Verified
Correct Answer:
Verified
Q6: During the Great Recession,the unemployment rate climbed
Q7: The Great Depression,when compared to other economic
Q8: The Great Recession began in<br>A) December 2009.<br>B)
Q9: One of the reasons why the Great
Q10: The Great Recession was similar to most
Q12: During the Great Depression,the U.S.aggregate demand curve
Q13: Define and relate macroeconomic policy,fiscal policy,and monetary
Q14: If a classical economist were asked which
Q15: Explain the Great Depression and the Great
Q16: In regard to the macroeconomy,it is believed