Multiple Choice
Refer to the following graph to answer the following questions: 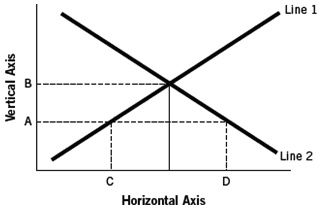
-Assuming the figure represents the market for loanable funds,it would be true that
A) line 1 represents savings (supply) ,and line 2 represents investment (demand) .
B) the vertical axis represents the interest rate,and the distance between points C and D represents the surplus of loanable funds at interest rate A.
C) line 1 represents investment demand,and line 2 represents savings.
D) the vertical axis represents the quantity of funds lent and borrowed,whereas the distance between points C and D represents the shortage of loanable funds at interest rate A.
E) line 1 represents the interest rate,and line 2 represents the quantity of savings.
Correct Answer:

Verified
Correct Answer:
Verified
Q8: You borrow $10,000 today at a nominal
Q9: Based on the relationship between consumption and
Q10: A young boy is saving money for
Q11: We could best describe the<br>A) nominal rate
Q12: Which description implies a drop in interest
Q14: The supply of loanable funds comes from<br>A)
Q15: The concept of the loanable funds market
Q16: The demand for loanable funds increases while
Q17: Businesses became more pessimistic during the Great
Q18: What would happen if foreigners no longer